Investigating ESXi PSOD crashes
AH! It’s PSOD! Let’s all run around and scream in terror as the apocalypse is upon us!
Well, not really.
A Purple Screen of Death (PSOD) is a diagnostic screen with white/grayish type on a purple background that is displayed when the VMkernel experiences a critical error, freezes and kills all running VMs.
Typically, the PSOD details the memory state at the time of the crash and includes other information (ESXi version+build, exception type, register dump, core dump, information etc.).
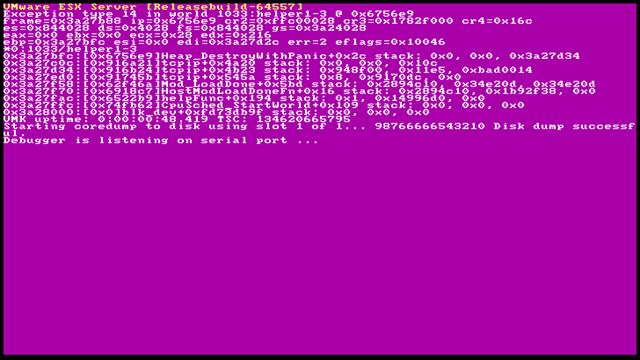
The core dump (or memory dump) is a file that contains further diagnostic information from a PSOD that can be given to VMware support to determine a root cause analysis for the failure.
The term – Purple Screen of Death – is a play on the Blue Screen of Death, the informal name given by users to the Windows general protection fault (GPF) error. You might have heard similar names given to different computer equipment errors such as RROD (Red Ring of Death – PlayStation 3/4) or GROD (Green Ring of Death – Xbox 360/One)
While one would figure PSOD is always caused by the hardware, it also could be software related. Please keep in mind, in this post we are going to assume the host can boot up and be connected to either vCenter or VI Client.
Troubleshooting⌗
Firstly, we need to reboot the host – there’s little to nothing you can do when it’s PSOD’ing. You might want to take a photo of the PSOD before the reboot just in case it would be needed later on.
After the reboot finished, you should try getting the logs off it – it might be unstable to you need to be quick. This can be done either through vSphere or vSphere Client (ESXi & vCS 6.0 and older). Log into either and right click on the host and select “Export > Export System Logs”. In the following window, choose all the logs available and a location to which the logs should be saved. Clicking Next will start the export process.
The logs will be double compressed (zipped), so you’ll need to extract them twice (nested archiving lol). The file structure after the extraction will look similar to this:
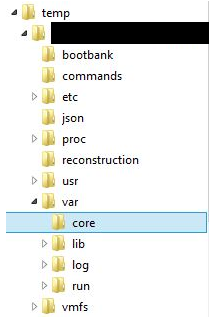
The logs we are interested in (vmkernel-zdump’s) should be located in the following folder /var/core/
These logs – vmkernel-zdump* – are a direct copy of the memory content at the time of PSOD. Use an editor such as Notepad++ (Windows) or Sublime Text (Linux) to open them. At this point, you can use the search function in your text editor to look for phrases such as error, fail or panic – you should be able to see a corresponding error codes next to these words which you can then google to troubleshoot the root cause of the PSOD. At the same time you can run a memory diagnostics on your host and find the offending memory modules.
Manual Dumping⌗
If you end up finding none vmkernel-zdump* files in the core folder, you can try the following:
- Log into the affected host and look at your disk and find the “Unknown” partition (i.e.
/dev/cciss/c0d0p9) - Run the command:
fdisk -l /dev/cciss/c0d0Which will return something similar to:Disk /dev/cciss/c0d0: 146.7 GB, 146778685440 bytes 255 heads, 63 sectors/track, 17844 cylinders Units = cylinders of 16065 * 512 = 8225280 bytesDevice Boot Start End Blocks Id System /dev/cciss/c0d0p1 * 1 65 522081 83 Linux /dev/cciss/c0d0p2 66 1370 10482412+ 83 Linux /dev/cciss/c0d0p3 1371 1631 2096482+ 82 Linux swap /dev/cciss/c0d0p4 1632 17844 130230922+ f Win95 Ext’d (LBA) /dev/cciss/c0d0p5 1632 1892 2096451 83 Linux /dev/cciss/c0d0p6 1893 2153 2096451 83 Linux /dev/cciss/c0d0p7 2154 2414 2096451 83 Linux /dev/cciss/c0d0p8 2415 2479 522081 83 Linux /dev/cciss/c0d0p9 2480 2493 112423+ fc Unknown - Next, run the this command to get the memory dump:
vmkdump -d /dev/cciss/c0d0p9 - Afterwards, dump the binary dump to a useful log:
vmkdump -l vmkernel-zdump.1 - Finally, analyze the dump (or connect to the host through sftp to download the resulting file to your troubleshooting workstation):
tail -20 vmkernel-log.1